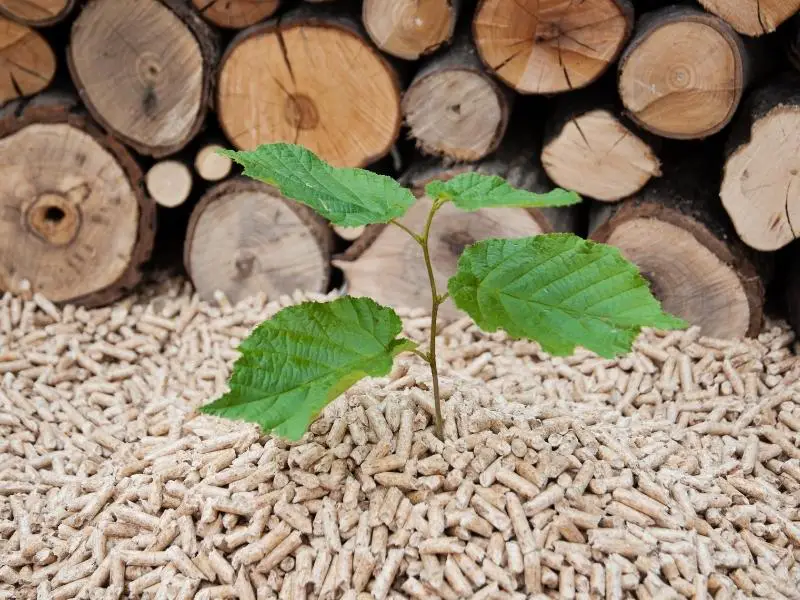
The global move away from coal towards renewable energy requires reimagining our world. One such shift is reframing trees and scraggly scrub as jet fuel. But if, like me, you’ve only ever gazed at a forest, knowing how biomass is calculated is deceptively tricky.
Biomass is measured in g/m2 and calculated in various ways. Indirect methods weigh materials that correlate with the vegetation of interest and then use regression tables to deduce the biomass. Direct methods weigh samples from the area of interest and extrapolate biomass from the specimens.
This article will take a look at:
- A working definition of biomass.
- The types of biomass.
- The inherent problem with calculating biomass.
- Different approaches to overcoming the biomass calculation problem.
But these methods are error-prone, and managing the estimation risk requires a deep dive into the details of weight-watching for weeds.
What Are We Weighing?
Biomass is a measure of the organic matter in a given area at a point in time.
Some definitions and examples will clarify the object of our inquiry.
Defining Biomass
Biomass is a contraction of “biological mass.” It refers to the “over-dried” weight of organic matter in an ecosystem at a point in time. This quantity is also referred to as “production.” It refers to living and dead organisms alike.
Over-drying is important as biological materials hold water to varying degrees. This water adds to the mass of the vegetation but is of no benefit to energy extraction. One element that makes coal a more efficient energy source than wood is that much energy in wood-burning is diverted to evaporating inert moisture.
Note also that biomass is defined relative to an ecosystem. The term is widely used in reference to energy-harvestable material out of context, but the interest typically yields a specified geographic locale.
Types Of Biomass
Differentiating biomass by type is important in the measuring process. Separation is because some materials are more tractable and in different ways to the various methods of calculating biomass.
This need largely stems from the estimation method by measuring correlations – where different types have different correlations, including varying coefficients of correlation.
Other factors that weigh in favor of differentiation are;
- Moisture: Water retention varies between different types of biomass. Moisture affects the applicability of assumptions around drying.
- Visibility: Not all types of vegetation are equally visible, making for differences in estimation.
- Seasonality: Adjustments must be made for biomass whose presence in the area fluctuates over time.
Below are indicative types of biomass in a forestry context:
- Superficial live tree biomass
- Flowers and fruit.*
- Tree foliage.
- Bark.
- Branches.
- Stem and wood.
- Subterranean live tree biomass
- Roots.
- Seeds.
- Rhizome stems.
- Rhizome roots.
- Superficial dead biomass
- Dead standing tree stumps.
- Dead fallen tree stumps.
- Dead branches.
- Woody decayed debris.
- Other organic ground cover
- Small live trees and their foliage.
- Grass and bryoids.
- Shrubs and herbs.
- Moss and lichen.
- Fungi.
- Soil organic matter
- Decaying foliage.
- Other humus material.
*These are not harvested for energy and are ignored.
Why Should Biomass Be Weighed?
There are two demand drivers for the calculation of biomass:
- Bioenergy.
- Conservation.
Bioenergy
Fuel energy extracted directly or indirectly from biological sources is called bioenergy. Sources of biofuel include trees, rice hulls, corn, peanut shells, grass clippings, sugar cane, manure municipal solid waste, and leaves.
In developing regions, the primary sources of biofuels are crop residue, wood, and dung. It is estimated that the global annual production of plant biomass is 2,740 Quads. The figure is eight times the global annual demand for energy, indicating the massive potential of biomass as a renewable energy source.
In the planning of bioenergy plants, the quantum of locally available feedstock determines the viability of the plant. The ability to estimate this quantity with confidence enables resource planning for the energy plant.
Conservation
Plant biomass plays several key roles in the conservation of ecosystems:
- Mitigation: Planit biomass plays a role in offsetting erosion from water and wind.
- Animal Habitation: Animals feed off plant biomass. It also provides bedding.
- Fertilization: Decayed plant matter nourishes the soil. Plant rot enables the sustainability of the ecosystem.
In areas where organic material is culled (e.g., for biofuel), the residual biomass needs to be assessed in order to ensure that the harvest rate is not above what permits the replenishment of the natural reserve.
What’s The Biomass Weighing Problem?
Biomass does not lend itself to direct mass measurement as it is unwieldy to handle and difficult to fully observe.
We’re accustomed to reading mass off a scale. Since we do this with our food and bodies – both biological masses – biomass should yield to the same device. There are some problems with this straightforward approach:
- Scale: In the context of energy extraction, the quantities of biomass are too big to fit onto a scale. Think of forests – a typical unit of interest. When measuring grams by the hectare mass is too large to observe.
- Variability: Vegetation changes with the season. There are more seeds in Springtime, more fruit in the harvest, fewer leaves in Winter. Accounting for this variance requires that direct observation be supplemented with calculation.
- Accessibility: Some biomass is physically unobservable. It may be underground (in the case of roots – which make up the bulk of the mass of a tree) or underwater, in the case of aquatic biomass.
The methods described in this post are designed to get around these limitations. But each method brings about its problems, subsumed under the heading of “model risk.” The term refers to the effects of the simplifying assumptions that are made to affect the calculations for weighing the biomass.
Knowing how to assess the model risk that attaches to the approach you’ve chosen helps you manage your weighing exercise, to minimize these risks. It also better equips you to attach the right degree of caution to a reading of the results.
What Are Common Approaches To Calculating Biomass?
Practical strategies for calculating biomass are based on broader approaches. These involve either direct estimation through weighting samples, or indirect means by working off the known weights of similar organic matter.
We consider the four categories into which the calculation methodologies are grouped.
Direct Estimation
The weight-estimation method was introduced in the 1950s and has been refined since to improve its efficiency and accuracy. This method involves determining biomass from the sampling of quadrats. It functions best in ecosystems with few varieties of vegetation and is particularly suited to scrubland.
Direct inspection is a visual method. The first step is to train observers to visually estimate biomass for individual species. The following steps are involved:
- Nominate a weight unit for the species under observation. This is a part of the plant that can be easily visually identified.
- Train the observer to visually assess the mass of weight units on a sample of clippings. This is an iterative process.
- Demarcate stratified quadrats of the area under inspection. Taken together, these quadrats should represent the biodiversity of the total area.
- For each quadrat, carry out the following:
- For each identified weight unit, calculate mi = wui x m(WUI), where wui is a weight unit and m() a mass function.
- Calculate mq = Sum(mi)
- Obtain a dry-weight conversion factor for the vegetation in question. This is the reciprocal of the water content of the species.
- Biomass = Sum(mqi) x Area(Total)/Sum(Area(qi)) x df where
- qi is a quadrat and i ranges over all the quadrats.
- df is the dry-weight factor in 5.
Note that it is convenient to train observers to assess on the basis of wet weight with the dry weight conversion happening in the laboratory.
Weight units should be chosen with some care:
- They must be visually distinct.
- They should not be too small to be lost to the eye.
- Each unit should correspond to a discreet portion of each species.
This method has its plusses and minuses.
Direct Observation Pros
- Low tech: No specialized equipment is needed.
- Transparency: The method is easy to understand and consequently can be easily adapted and corrected. Troubleshooting results requires no specialized knowledge.
- Speed: Trained observers can estimate biomass over vast areas in little time.
- Cost: This is an inexpensive method.
Direct Observation Cons
- Precision: The method is imprecise.
- Speed: The training of observers can be time-consuming.
- Complexity: The reliability rapidly decays with biodiversity in the area under observation.
- Low Tech: No automation is used to create efficiencies.
- Stability: Observers have been shown to experience drift in their estimates over time and proneness to estimation error as a function of quadrat size.
Indirect Estimation
Instead of measuring the biomass, this class of techniques measures factors that correlate with the biomass. In practice, these factors are counted, and biomass is calculated by multiplying the count with a correlate drawn from a correlation table.
There are various indirect methods. We consider three: integrated height and cover, disc meters, and visual obstruction reading.
Integrated Height And Cover Estimation
To calculate the mass of a rectangular prism, like a brick, it is not necessary to weigh all of its material. We could instead multiply its dimensions (height, weight, and breadth) by its known density.
This is the basis for the Height and Cover method. The ground cover represents the surface area of scrub and so is analogous to breadth x width. The analog for density is the biomass of known samples of similar vegetation. This is stored in correlation tables.
The Height x Cover method runs as follows:
- Obtain biomass correlation coefficients for the vegetation in the area of reference.
- Measure the height (H) and cover (C) of a sample area.
- The cover is breadth x width for rectangular areas.
- For irregular areas, fit maximally overlapping rectangles and calculate Cover = Sum(width x breadth), where i ranges over the overlapping triangles.
- Biomass = H x C x cf where cf is a correlation coefficient drawn appropriately from the table in 1.
Various modifications have been made to improve the accuracy of this method. This includes double-sampling, average height sampling, and the calibration of correction factors.
Disc Meters
The precursor to the disc meter was a cardboard rectangle. This would be dropped from waist height onto the vegetation. How high the square rested was a function of the height and ground cover of the underlying foliage.
The weight of the cardboard would indicate the bulk of the scrub, as the rest implies a weight equilibrium.
These calculations are not as easy to carry out at direct and indirect observation, but they have been somewhat automated in a disc meter. This is a tool that replaces the cardboard with a proprioceptive disc that calculates the statistics by measuring its own displacement.
Output from the disc meter provides biomass for a sample, which can be extrapolated to total biomass by scaling up to the total area.
Relative Weight Estimation
Relative weight estimation arose in response to critiques of the direct observation method. It was noted that the following human factors contribute to the ineffectiveness of direct observation:
- Memory: Human observers are trained to rely on memorized estimates which may not correspond with current conditions.
- Fatigue: The accuracy of observations decays with the onset of fatigue and changes in mood.
- Training: The need for in-season retraining increased the cost overhead.
It was noted that it would be easier to train observers to notice the relative difference in biomass rather than absolute quantities. This is the basis of relative weight estimation:
- Nominate a weight unit as in the Direct Observation method.
- Nominate an observable reference base. This would be a putative microcosm of the area under inspection.
- Let wub = the number of weight units observed (by the observer) in the reference sample.
- Biomass = Biomass(base) x wuT x wub where:
- wuT is the total number of weight units counted in the area under review
- Biomass(base) is the total biomass of the reference sample.
Note that the requirement to train observers to make weight estimations falls away. So too does the calculation of a dry-weight factor. The biomass of the base is calculated by harvesting, drying, and weighing.
This method has been shown to have improved reliability (over direct observation) and to work best with total biomass over other factors that could be estimated similarly. It is enhanced with double-sampling, in which an average count from more than one observer is used.
Electronic Estimation
Machines were introduced to manage the limits of naked-eye visualization. Initially, they helped with double-sampling and later came to be used to measure capacitance and leaf cover.
Measuring Capacitance
Capacitance measures were originally used to gauge the water content of foliage. This would cue the dry weight factor to be used at the end of the estimation. Later it was discovered the capacitance could be used to estimate the mass of foliage.
Despite early promise, capacitance has yielded mixed results as a biomass calculator:
- The capacitors are less effective as moisture content decreases.
- Even for moist foliage, wide variances in readings have been detected in studies.
- The technique is compromised by unevenness of the ground, trampling of vegetation, and heterogeneity of the flora.
A cautious application has been advised.
Canopy Analysis
The orientation, shape, and position of leaves, fruit, and stems are known as canopy structures. The Leaf Area Index (LAI) expresses leaf area as a percentage of ground cover. It is a ubiquitous canopy structure metric.
The LAI method uses a fish-eye optical lens to discern gaps in the ground cover by comparing light intensity in the areas above and below the cover. This accounts for all opaque elements of the canopy structure.
Studies have found this to be a useful tool for measuring changes in biomass over time, while there are difficulties in estimating the absolute biomass. For one, the use of light intensity does not differentiate between living material and dead, which is critical in the ways we’ve canvassed above.
This approach is favored in rangeland inventory systems. It is suited to trees and shrubs where harvesting is an impractical method of assessing biomass. It is advisable to deploy a combination of canopy factors rather than a single one.
Multifactor models have been shown to be more reliable in practice. They do, however, require the maintenance of more unwieldy correlation tables. Density estimates need to be maintained, and caution must be taken against misapplying density and correlation statistics to areas where a similar canopy obscures key differences from the area of origination.
References